|
This page provides with the tables, fitsfiles, and dataproducts in general generated by different members of the CALIFA collaboration as part of their science studies. All those datasets are distributed freely by those members to be used under the condition of citing the corresponding articles and giving the proper credit to the people that have elaborated them.To cite the quoted article is mandatory.
|
|
The following science data products are provided:
|

|
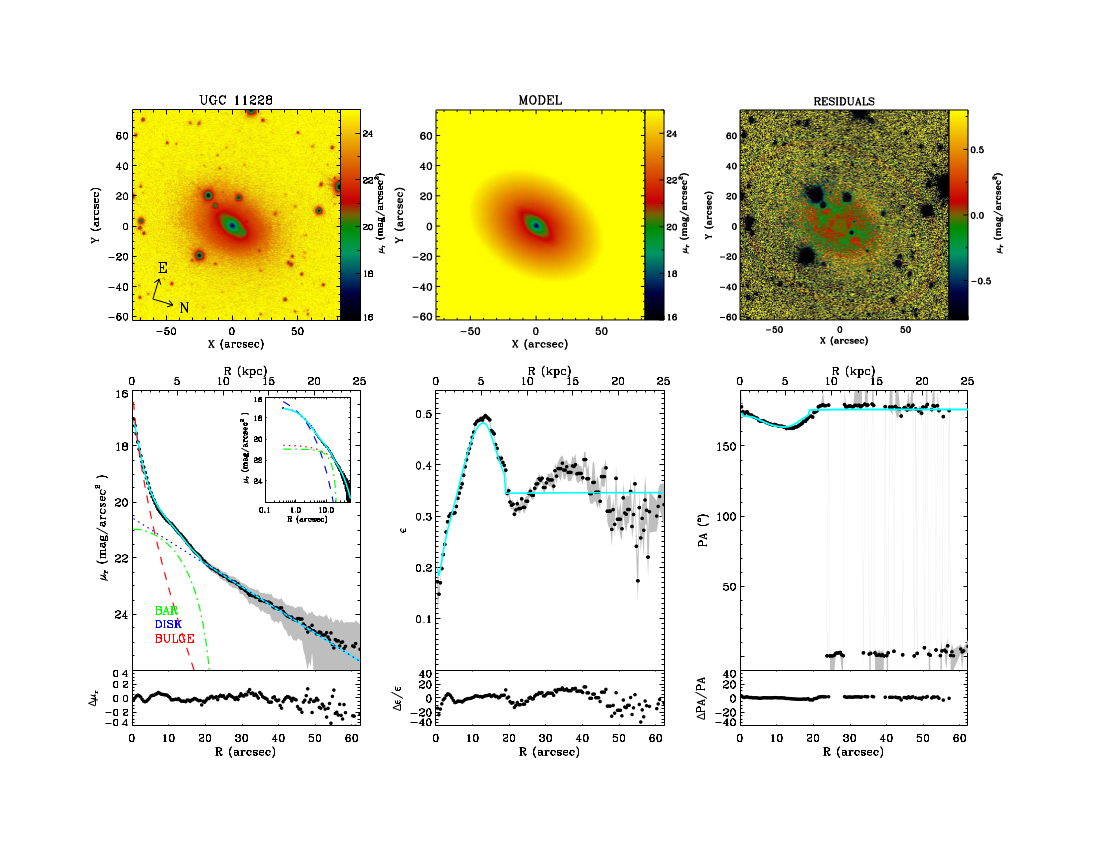
- Star Formation in the Local Universe from the CALIFA Sample. II. Activation and Quenching Mechanisms in Bulges, Bars, and Disks (Catalan-Torrecilla et al, 2017, ApJ, 848, 87):
Left Figure: Example of the spectrophotometric decomposition performed for the galaxy NGC2253. At the left it is shown the g-band models for the three analyzed components (disk, bulge and bar). Central panel shows the derived Ha distribution for each component. Right panel shows the integrated spectra and the best fitted model, with the residuals (Fig. 1 in article).
|
|
|
|
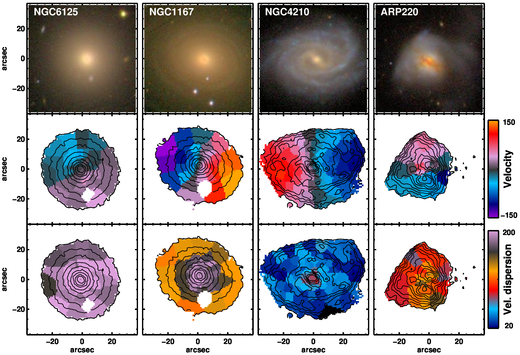
- Stellar Kinematics based on the analysis of the V1200 setup (Falcon-Barroso et al. 2016, A&A, accepted):
Left Panel: Examples of line-of-sight stellar kinematic maps from the CALIFA V1200 grating dataset. (Top row) Color-composite SDSS image of each galaxy. (Middle row) Stellar velocity maps. (Bottom row) Stellar velocity dispersion maps. From left to right: NGC6125, a slow-rotator elliptical in our sample (i.e., low velocity amplitude and overall large velocity dispersion); NGC1167, an early-type spiral galaxy with large velocity and central velocity dispersion amplitudes; NGC4210, a disk-dominated galaxy (i.e., high velocity amplitude and overall small velocity dispersion); ARP220, an interacting system (i.e., with complex stellar velocity and velocity dispersions maps). All maps share the same velocity and velocity dispersion scale and are in units of km/s as indicated in the colorbars. Isophotes (black lines) are constructed from the V1200 CALIFA data cube.
|
|
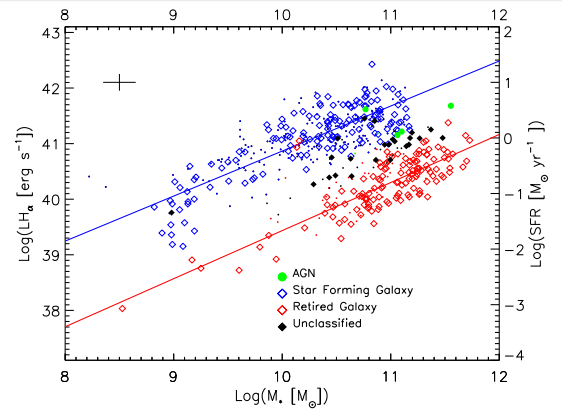
- Spatially Resolved Star Formation Main Sequence of Galaxies in the CALIFA Survey (Cano Diaz et al., 2016, ApJ, 821, 26):
Left Panel: Fig 1 of the article. Integrated SFMS. Each galaxy is represented by a figure in the plot. Blue points indicate galaxies which ionization is dominated by SF, while red galaxies are retired galaxies. Green points are dominated by AGN ionization, while black ones indicate galaxies with unclear classification.
|
|
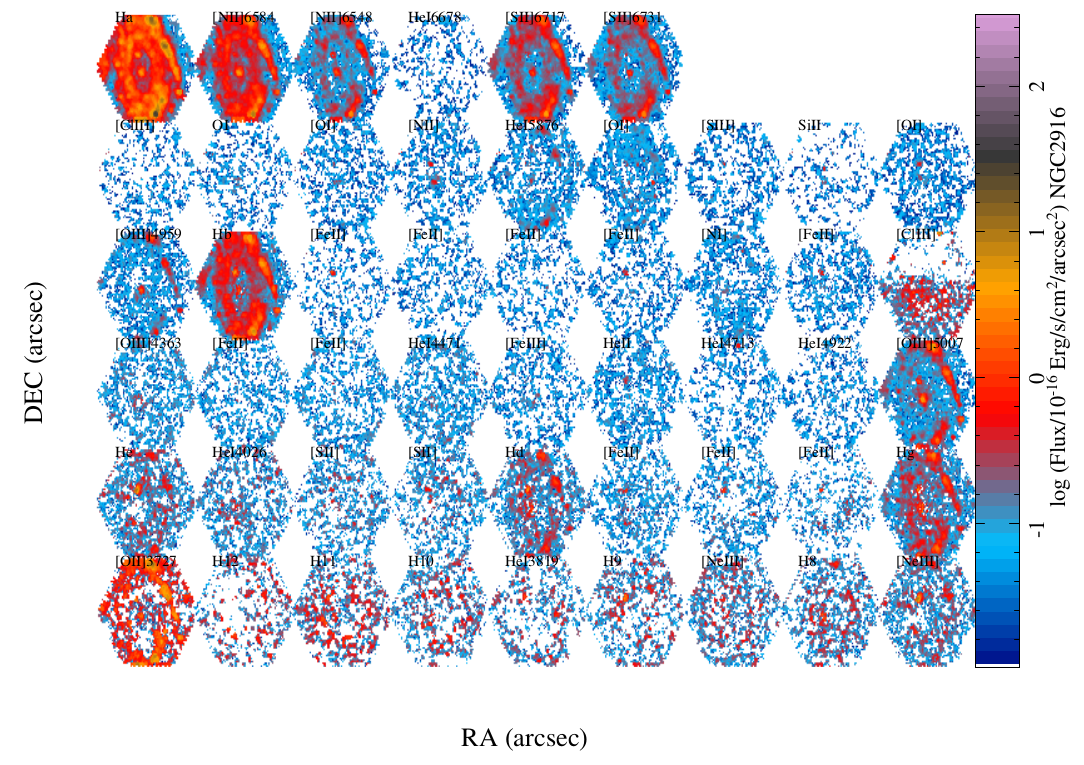
- Stellar and Gas properties derived by Pipe3D (Sanchez et al. 2016, RMxAA, 52, 171):
Left Panel: Flux intensity maps for all the emission lines listed in Table 1 and analyzed following the procedure described in Sec. 3.6 of the article, in units of 10−17 erg s−1 cm−2 arcsec−1 , derived for NGC 2916.
|
|
|